What Your Logs Aren’t Telling You: Why Engineers Need Integration Observability

When systems go down, integrations break, or pipelines silently fail, logs are the first place engineers turn. But traditional application logging—designed for tracking application state or debugging isolated services—was never built for complex, multi-system workflows. It’s not just that logs can be noisy, they’re incomplete.
If you’re responsible for maintaining integrations across internal systems, cloud services, and third-party platforms, relying on logs alone is like debugging with a blindfold on. You might see what failed, but not why. Even worse, you may never know it occurred in the first place.
The Blind Spots of Traditional Logging
Most engineers already know how to grep through logs, filter for specific error types, or trace the execution of a given endpoint. But integrations behave differently from product code. They’re distributed, asynchronous, and deeply dependent on external systems that are often outside your control.
Here’s what your logs likely don’t give you:
- Workflow-level visibility:
You might see individual function calls or HTTP requests, but you’re not seeing the end-to-end flow from trigger to action across multiple tools and services. - Business context:
Logs may tell you an API call failed, but they don’t tell you which customer, order, or transaction was affected—or if it retried successfully. - Real-time health indicators:
There’s no built-in way to understand if your integrations are running slower than expected, silently skipping records, or piling up in retry queues. - System-wide impact:
A small delay in a webhook processor can create cascading latency in downstream processes. Logs won’t surface these glitches unless you’ve explicitly instrumented every link in the chain.
In integration-heavy environments, these blind spots aren’t just technical challenges—they’re operational liabilities.
Why Integration Observability Is Different
Observability for integrations isn’t just about capturing more data. It’s about capturing the right data—across the entire lifecycle of a workflow.
That means tracking:
- Trigger sources (e.g., scheduled jobs, webhooks, event queues)
- Input payloads and transformation logic
- API calls to third-party tools
- Conditional logic branches and parallel executions
- Retries, backoffs, and timeouts
- Failures, exceptions, and manual overrides
- Final outcomes and downstream effects
With proper integration observability, you’re not just looking at technical logs—you’re looking at the behavior of your business processes in motion.
What Happens Without It
Without dedicated observability tooling for your integration layer, every operational question turns into a support ticket:
- “Why didn’t this order get routed to fulfillment?”
- “Why did this lead get missed in our CRM?”
- “Why is staging syncing data, but production isn’t?”
- “Why is this Lambda timing out every third run?”
Answering these questions takes time. And worse, you’re usually answering them reactively—after a customer reports an issue or a stakeholder flags something broken.
This leads to mounting support debt, inconsistent debugging practices, and a growing dependency on whoever originally built the workflow.
How Lumino Solves This
Lumino was built to provide first-class observability for integration and orchestration layers. Instead of relying on ad hoc log statements and disconnected tools, it gives engineering and ops teams a unified view into the workflows that drive internal automation and external system coordination.
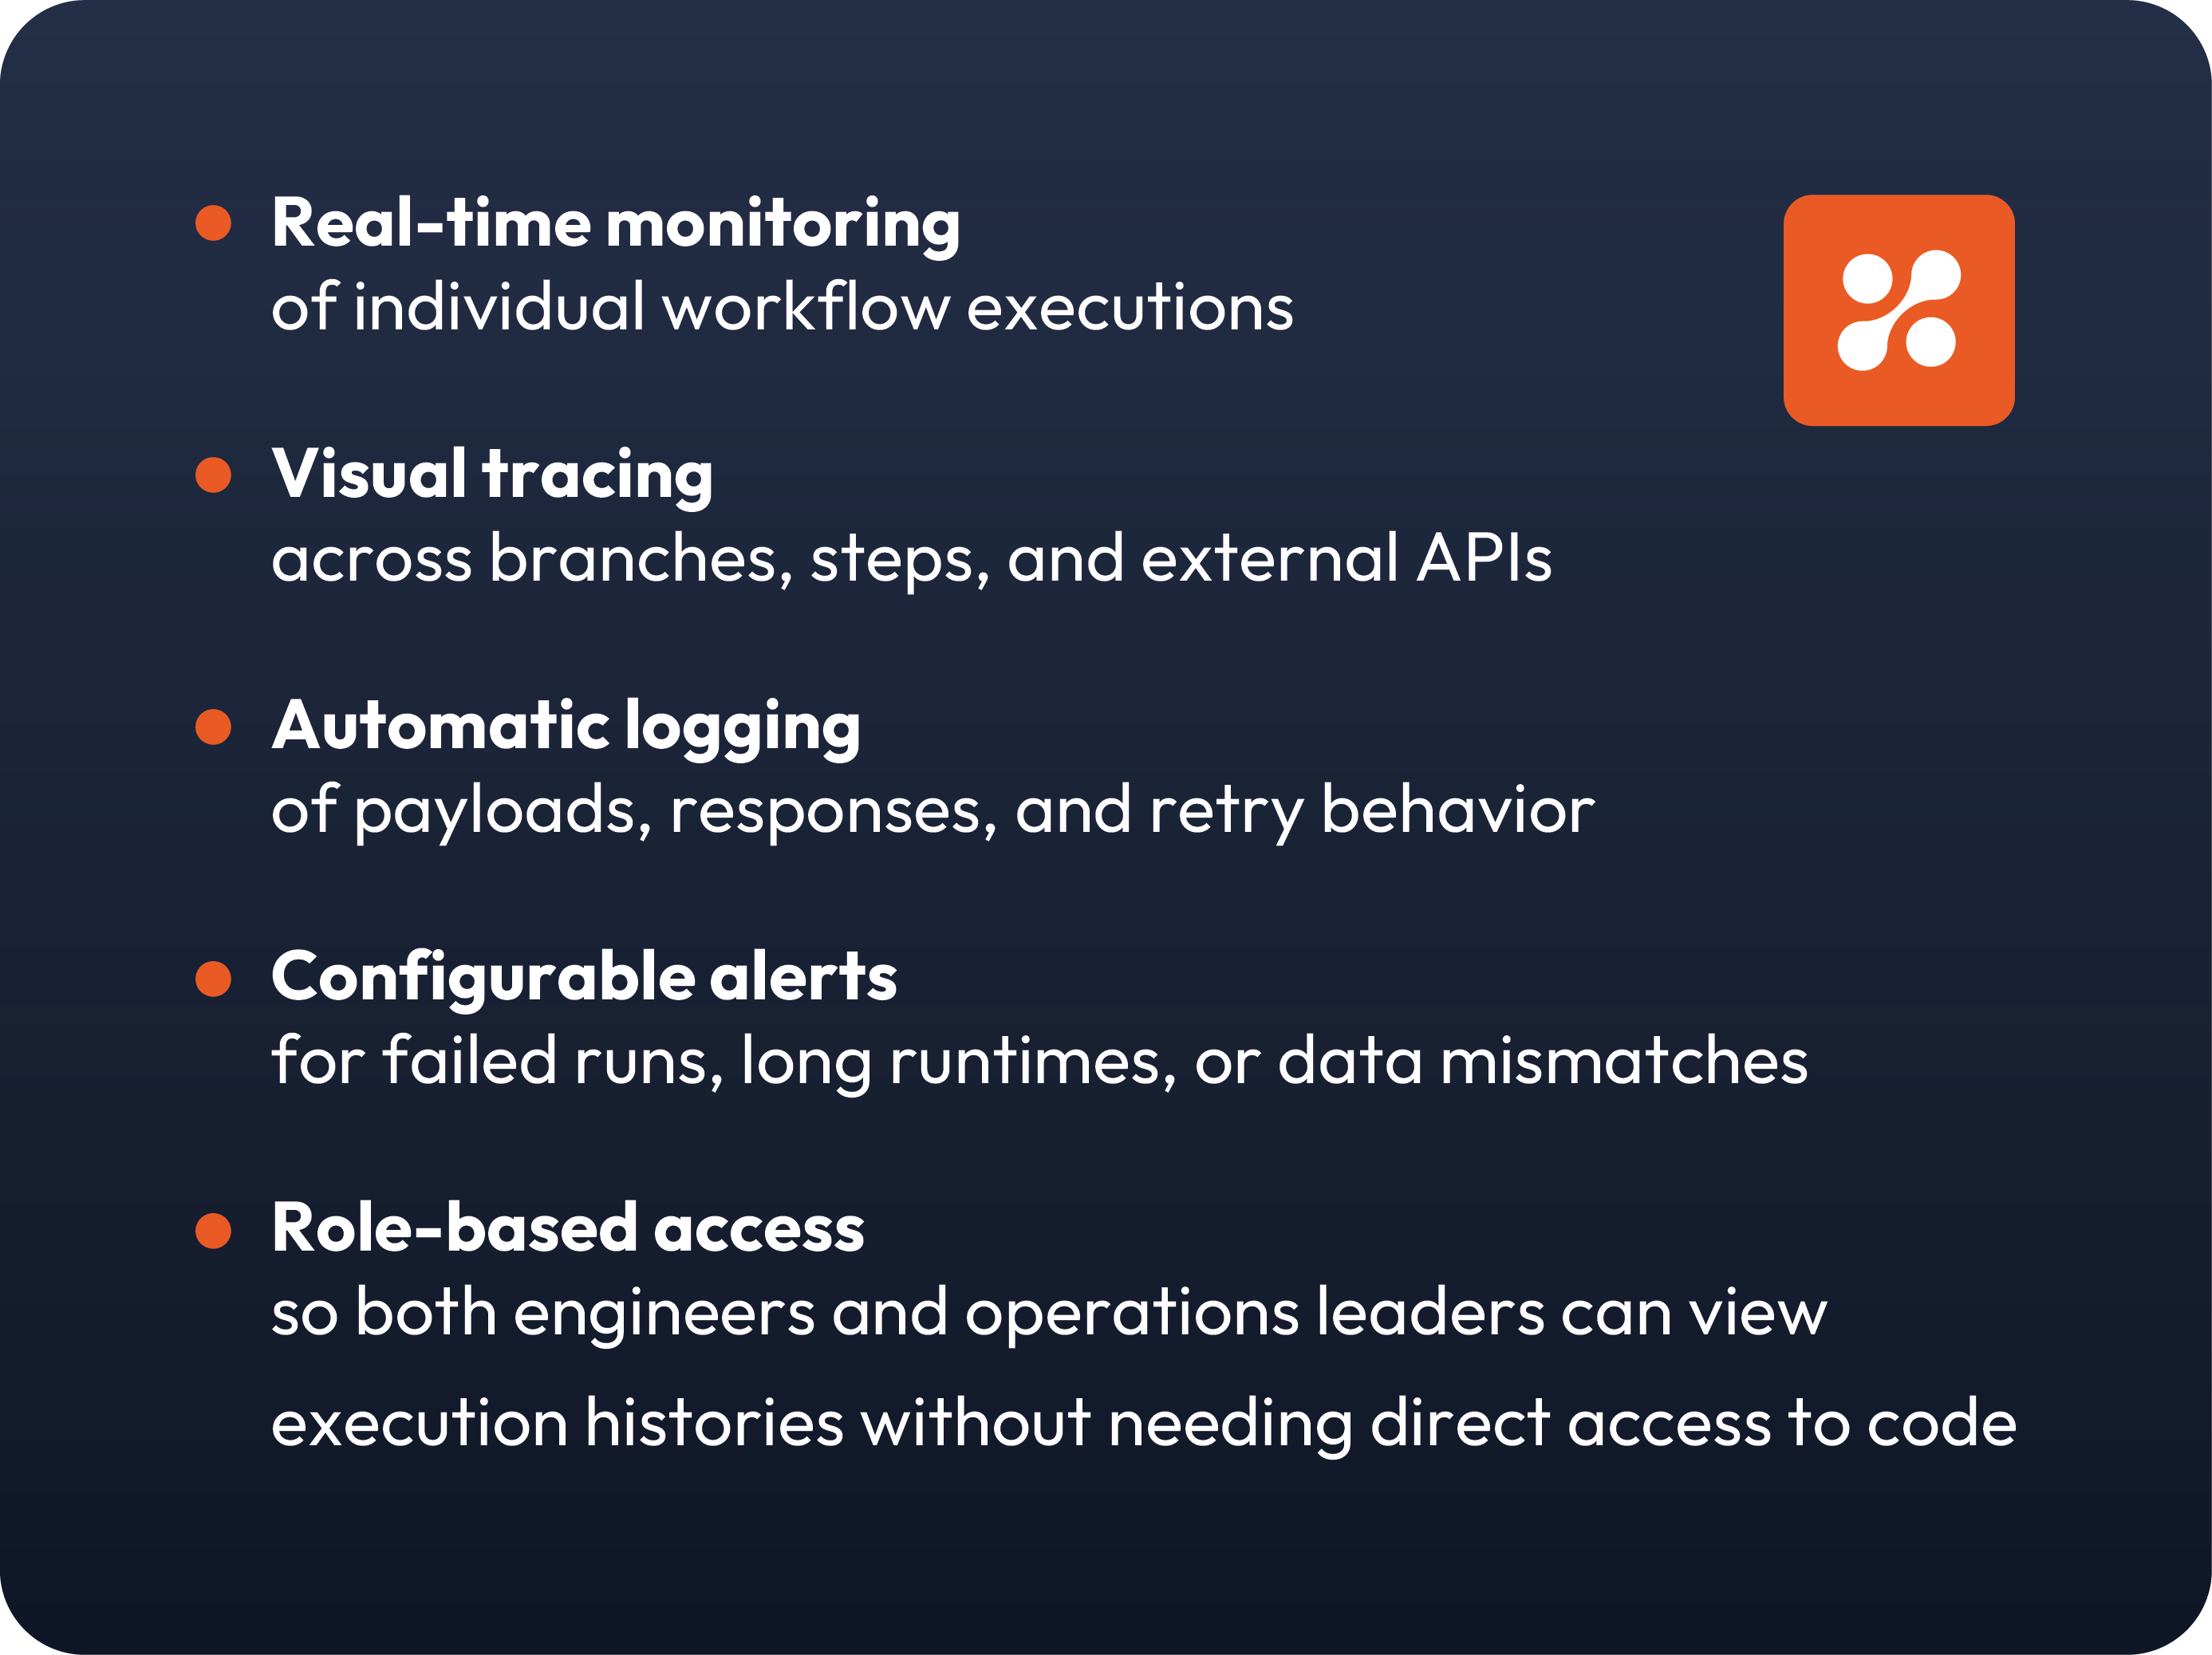
Lumino enables:

Lumino provides comprehensive observability features designed specifically for integration workflows. Engineers can monitor individual executions in real time, gaining immediate insight into how workflows behave across environments.
The platform offers full visual tracing, making it easy to follow the logic across branches, conditional steps, and external API calls. Each execution automatically logs payloads, responses, transformation details, and retry behavior, so there’s no need to instrument each flow manually. Alerts can be configured based on failure conditions, runtime thresholds, or data mismatches, ensuring that issues are surfaced proactively rather than after the fact. What’s more, with role-based access controls both technical and non-technical users—from developers to operations leads—can review workflow execution histories without needing access to the underlying codebase.
This makes it possible to troubleshoot integrations in minutes—not hours—and to proactively identify patterns or slowdowns before they escalate into full-blown incidents.
Integration is Infrastructure
Most teams wouldn’t run production workloads without metrics, logs, and dashboards. But the same teams often run critical integration flows in the dark. That’s no longer sustainable.
As your organization becomes more connected—across cloud platforms, internal tools, and vendor APIs—the need for purpose-built integration observability grows. Lumino isn’t just solving for visibility; it’s solving for control, traceability, and long-term maintainability.